| | 141 | |
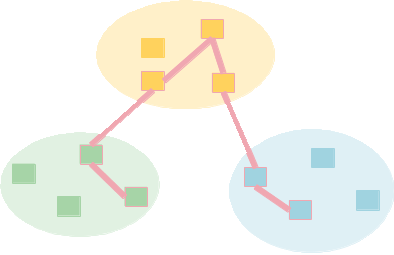
| | 142 | Once the DETER experiments begin to swap in, you can watch the activity logs on the [http://www.isi.deterlab.net DETER web interface] to see what the individual experiments are doing. In this example, you would look at SAFER/faber-multi-b and TIED/faber-multi-a. The projects come from knowing the projects to which each sub-part was assigned; the experiment names come from the log. |
| | 143 | |
| | 144 | The fedd logs are also world-readable on users.isi.deterlab.net. To watch a multi-party swap-in, the following logs may be interesting: |
| | 145 | |
| | 146 | {{{ |
| | 147 | /var/log/fedd.log # the main experiment controller log |
| | 148 | /var/log/fedd.deter.log # the log for the DETER testbed access controller (the component swapping experiments) |
| | 149 | /var/log/fedd.internal.log # the log for the access controller handing out VLANs to interconnect on DETER |
| | 150 | }}} |
| | 151 | |
| | 152 | The easiest way to view them is: |
| | 153 | {{{ |
| | 154 | $ tail -f /var/log/fedd.log |
| | 155 | }}} |
| | 156 | |
| | 157 | == Experiment Status == |
| | 158 | |
| | 159 | Once the experiment is started you can look at and control the individual pieces using standard DETER interfaces. You can get the topology from the [FeddCommands#fedd_ftopo.py fedd_ftopo.py] command. |
| | 160 | |
| | 161 | {{{ |
| | 162 | $ fedd_ftopo.py --experiment_name faber-multi |
| | 163 | d:pc027.isi.deterlab.net:deter/b |
| | 164 | e:pc020.isi.deterlab.net:deter/b |
| | 165 | a:pc009.isi.deterlab.net:deter/a |
| | 166 | b:pc044.isi.deterlab.net:deter/a |
| | 167 | c:pc022.isi.deterlab.net:deter/b |
| | 168 | }}} |
| | 169 | |
| | 170 | You can manipulate the various parts by logging into the machines or using SEER. |
